In this project, I'm going to be looking at the sales data of a supermarket. I'm using various Python libraries for the purpose of the data analysis. The primary objectives are to understand the data's distribution, explore relationships between columns, and identify potential correlations using visualizations.
You can find a link to the dataset and code below:
I'm starting by importing the libraries I'll be using.

To get a better picture of the data I'll take a look at the first few rows of data as well as the column names and their datatypes.

Since the Data column is not a date format I'll change that using a pandas function as well as set the Date column as the index for the dataframe.


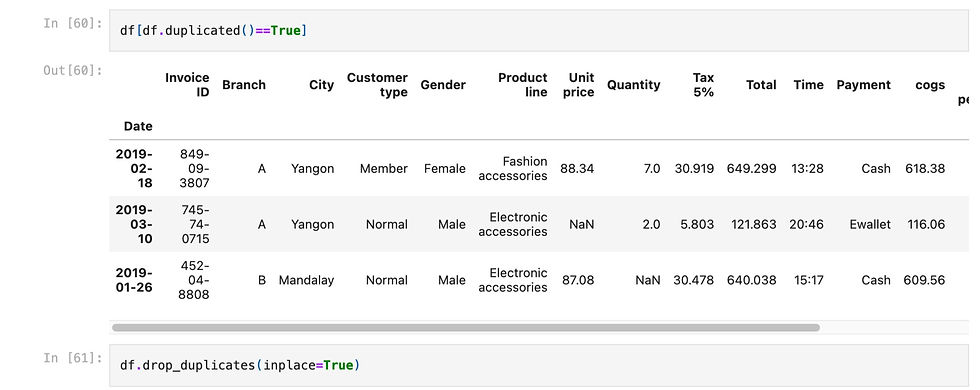
I want to see if we have any missing values or duplicates within the data:
For the categorical columns I will replace the missing values with the mod of the column:


And for the numerical columns I'll replace the missing values with the mean of the column:

Next, I'll be using the distplot function from seaborn to see the distribution of the customer ratings. The distplot function creates a histogram and Kernel Density Estimate (KDE) plot in the same visualization which is helpful for univariate analysis.

Since distplot will be removed in seaborn v0.14.0., you can create a similar visual with the histogram function. I can also plot lines showing each quarter:

Using the hist() function from matplotlib I can create histograms to see the distribution of data for each column:

I can also use a bar chart to compare sales for each branch:


Or compare payment types:

In the next step of the analysis I will be looking at the relationship between two columns.
I'm going to begin by seeing if there's a relationship between Rating and Gross Income.

The changes in Ratings don't seem to be related to the changes in gross income.
Next I want to know if there is a noticeable time trend in gross income.
Since there are multiple invoices on any given date, we must aggregate the rest of the numerical columns such as Rating and group by the date. In this instance the average Rating on that date is what we're looking for.


In the final step of the Analysis I will be determining whether there is a correlation between columns with a heatmap.


Comments